Student Class Chart
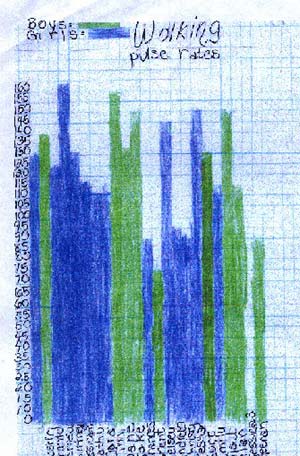 Students
used stop watches to record each other's pulse rates. The info was then
used to create the colored-pencil bar graph. Eventually, they created
a computer generated graph for running averages.
Students
used stop watches to record each other's pulse rates. The info was then
used to create the colored-pencil bar graph. Eventually, they created
a computer generated graph for running averages.
Student Class Chart
|